This article explains why U.S. wealth management firms need to factor in business performance when evaluating the balance between affordability of pay programs and retention of key talent.

Median Private Banking Revenues Down Approximately 8% at Midyear
Looking back at FY 2019 pay data, McLagan’s year-over-year analysis depicts strong differentiation across functions in total compensation increases. Given that 2019 was a relatively strong performance year, the sales function showed positive median and high quartile total compensation growth (+8% YoY at median), with RM and PM functions following closely behind (+5% YoY). Yet, product specialists, including bankers and trust specialists, saw lower numbers, with 3% YoY growth.
As they look ahead to 2021, wealth management firms must optimize the mix of transformational and business as usual (BAU) initiatives, and consider their impact on clients and advisors, if they are to improve revenues.
Historic compensation survey data continues to yield strong value for firms and it remains the most recent baseline, an anchor of sorts, that firms can use as both a reference point for a normal year and an input for salary, incentive budgets and allocation decisions heading into 2021.
2020, however, comes with a unique set of circumstances, creating additional ambiguity for year-end compensation decisions. Firm performance levels and operating models have been tested in an unprecedented manner. During H1 2020, the impact of the COVID-19 pandemic was significant, as median private banking revenue decreased by 3% and 5% in Q1 and Q2, respectively, essentially down about 8% at midyear.
Leaders across wealth management (WM) are actively evaluating the balance between the affordability relative to overall divisional profitability and employee retention. They are working through various challenges to ensure business continuity, offset lower sales projections, protect jobs and send a unifying message of shared sacrifices to their employees.
Discussions with WM organizations indicate slightly reduced outlooks for 2021 merit increases (1.5 - 2.5% central range, with some firms at or below 1.0%), including promotions, market adjustments and accounting for internal pay inequities. Annual incentive pools, at this time, are also projected to be lower, in many cases by more than 10%.
To proactively help rewards and performance professionals in year-end compensation and incentive decisions, it’s important to look beyond the 2019 performance year pay data and develop a broad set of pay projections to help gain clarity on year-end incentive pool decisions and compensation adjustments. Our analysis helps inform the compensation discussion in the context of business performance and assists human resources and leadership in the evaluation of the balance between affordability of pay programs and retention of key talent.
McLagan Forecasts a Range of Scenarios for Year-End Financial Performance
McLagan’s financial performance model initially informed our pay projections by accounting for historic firm performance records going back to the financial crisis to help identify how salary, incentive, non-compensation and margin levels responded to a variety of revenue scenarios. This financial view was then supported by an analysis of how total compensation within certain functions and levels compares to the overall firm change in incentive dollars and total compensation.
The reality is that it is difficult to predict exactly how firms will end the year. Therefore, the model’s variables and assumptions are continually challenged and updated. The current output reflects our most recent financial performance analysis and client polling across the sector as of the start of Q3 2020.
Assumptions have been set around margin increases, headcount, merit increases and expenses, which all factor into the projected compensation outcomes.
The identification of unknown factors is also a key part of scenario analysis modeling to combat uncertainty. For the wealth management industry, the impact of loan loss reserves and corporate financial performance are two such factors that could swing incentive pools notably lower.
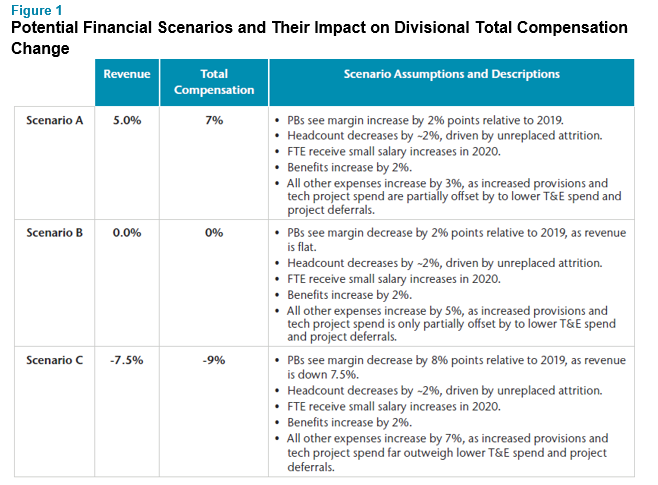
The lowest case scenario – a 7.5% decline in PB revenue – is expected to impact total compensation by 9%, coupled with a slight decline in FTE (primarily a result of not replacing leavers). Being prepared for a variety of revenue scenarios and their respective impacts on headcount, margins and compensation will be a valuable tool in navigating future uncertainty.
As of October 2020, we expect most private banking organizations to fall between scenarios B and C in terms of revenue performance. Clearly, wealth management firms are under pressure to find a more profitable growth route.
Firms Should Use Analysis and Modeling to Remain Ahead of Incentive Pool Funding Decisions
Naturally, there will be differentiation across firms. Observations from our analysis indicated that firms who are more investment-oriented have generally performed better in this environment and may even see revenue and corresponding compensation increases. On the other hand, those more heavily dependent on net interest income have struggled due to spread compression in a low interest rate environment.
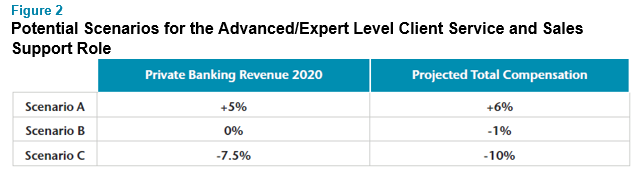
For example, client service and sales support roles across private banking firms experienced a 4% median total compensation increase from 2019 – 2020. Our predictive pay scenario analytics indicate three potential scenarios for the advanced/expert level client service and sales support roles:
Incentive pools have the largest potential swing range based on FY 2020 revenues. Firms should get ahead of pool funding decisions through appropriate modeling, analysis and evaluation of expected 2020 revenues and profitability.
Next Steps
For more tailored projections, McLagan’s wealth management team is ready to partner with your firm’s rewards and performance division to create a tailored compensation model based on your unique set of revenue, margin and headcount expectations. To speak with a member of our team, please contact your relationship manager or write to rewards-solutions@aon.com.
Related Articles