As the economy and businesses in the U.K. head towards COVID-19 recovery, many firms are reviewing their rewards strategies, including reassessing their approach to gender equality and pay gap reporting.

There’s been plenty of talk lately about what a “new normal” looks like as businesses, governments and citizens transition from crisis response into recovery from the COVID-19 pandemic. Many companies in the United Kingdom (U.K.) are wisely taking this time as an opportunity to proactively address their rewards strategies and how they approach the employee experience. In this process, gender pay equity remains a crucial piece of the puzzle.
Meaningful change in this area is typically recognised as a marathon rather than a sprint. Accordingly, businesses are taking steps to address the root causes of gender pay inequality in the workplace. The U.K. requires any organisation that has 250 or more employees to publish and report specific figures regarding their overall gender pay gap, including the mean and median difference between male and female hourly pay and bonus pay, in addition to the proportion of males and females in each of the pay quartiles. How well are these measures faring, though, and will disclosures in the upcoming cycle, especially with the hurdles presented by the COVID-19 pandemic, bring noticeable improvement? Now that time has passed relative to the close of another gender pay gap reporting cycle in April 2020, we are reminded of the importance of reflection.
This article takes a closer look at where firms in the U.K. currently stand in their gender pay gap journey and provides tips for navigating pay equity as companies rethink their rewards programs.
Are Pay Equity Efforts Making a Difference?
Unsurprisingly, the April 2020 reporting cycle brought with it new challenges because of the COVID-19 pandemic. Due to its immense impact on employers, the U.K. government made gender pay reporting non-compulsory for the 2019-20 reporting cycle, resulting in around only half of the cohort making submissions. We now need to start thinking about the next cycle and take the time to regroup, look back on the past and find ways to continuously lessen the gap.
To progress and determine where pay equity discrepancies lie, it’s important to look at the data firms provide and use this as a basis to make informed decisions in the future. Aon’s analysis includes a controlled sample of 4,602 companies across industries, all of which submitted data for the 2017, 2018 and 2019 reporting years. Results, as shown in figure 1, revealed that hourly pay gap progression remains minimal, whereas the bonus pay gap increased sharply between 2018-2019.
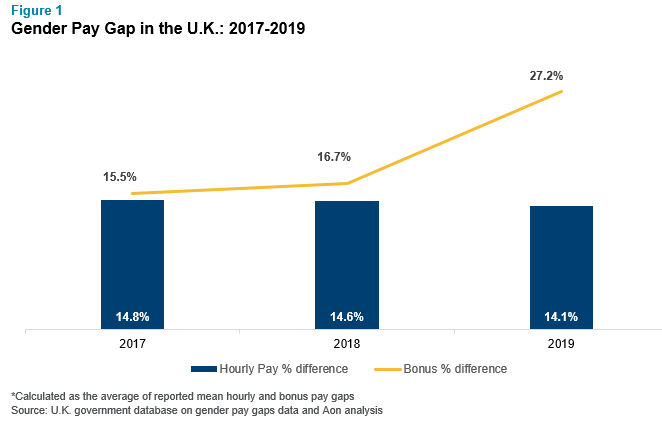
The average hourly pay percentage difference of females relative to males decreased by only 0.7 points from 2017 to 2019. Average bonus pay percent difference, however, tells a completely different story, showing a sharp increase between 2018 to 2019 of around 10 percentage points, once again highlighting the need for further action.
Since Figure 1 is based on the overall average across a constant sample of 4,602 organisations, it is subject to outliers. To delve further, we assessed our controlled sample and identified the general trends by comparing the change between years for the two available time frames: 2017 to 2018 and 2018 to 2019. The results of this analysis are shown in Figure 2, which outlines what percent of organisations reported a decreased gap, no change or an increased gap. For example, from 2017 to 2018, 53% of companies within our controlled sample reduced their hourly pay gap, while 3% of companies reported no change and 44% reported an increase.
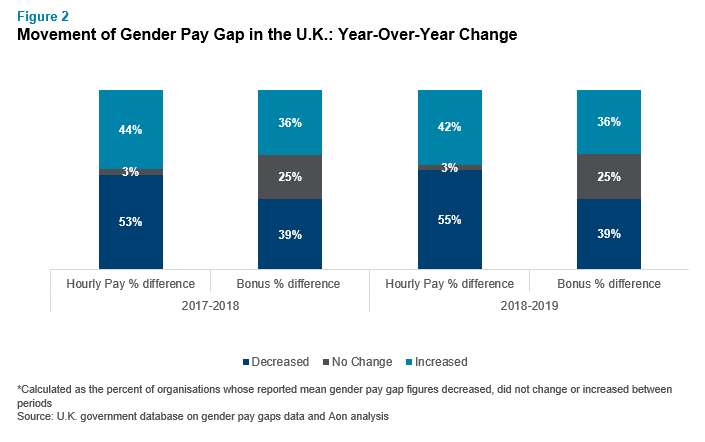
When we compare the data points year to year, we see a slight uptick in the percentage of firms that succeeded in decreasing their hourly pay gap, while there was no change in companies improving the bonus pay gap (remaining at 39%). This lack of movement may indicate that more attention needs to be diverted to short-term incentives.
Beyond analysing movement in the two periods in isolation, another angle we examined is the proportion of companies that reported a reduction in their pay gap during both 2017 to 2018 and 2018 to 2019. This is potentially a more reliable indicator of true change and action. Our findings indicated that a minority of companies showed consistent improvement in both time frames.
- Hourly pay gap: 26% of companies reported a reduction in their hourly pay gap in both 2017 to 2018 and 2018 to 2019
- Bonus pay: 16% of companies reported a reduction in their bonus pay gap in both 2017 to 2018 and 2018 to 2019
Another area of gender pay gap reporting data that we investigated was the proportion of women in the upper pay quartiles. This provides a clearer view on the extent to which organisations are promoting more women into senior leadership roles, serving as an indicator of true change. Figure 3 shows the average percent of female employees positioned in the upper two quartiles in 2017, 2018 and 2019.
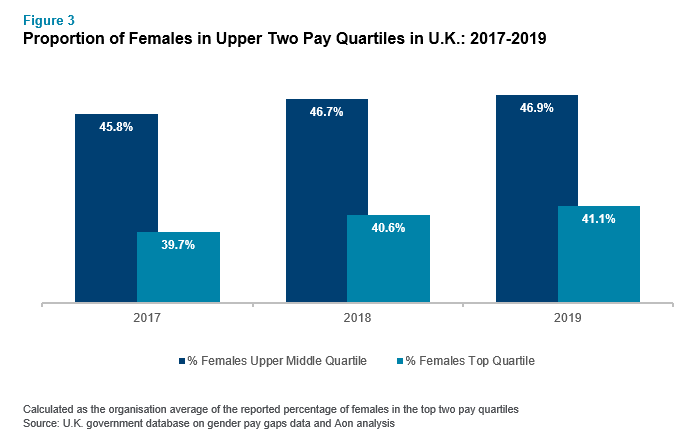
From 2017 to 2019, the average percent of females in the upper middle quartile and top quartile increased in every instance. Although the improvement is small, the direction is encouraging.
Figure 4 shows trends reflecting the position of females in the market from 2017 to 2018 and 2018 to 2019. For example, from 2017 to 2018, 51% of companies within our controlled sample reported a higher number of females in their top quartile. In 2018 to 2019, the equivalent figure jumped by two percentage points, meaning more firms reported an increase in females in the top quartile compared to the previous period.
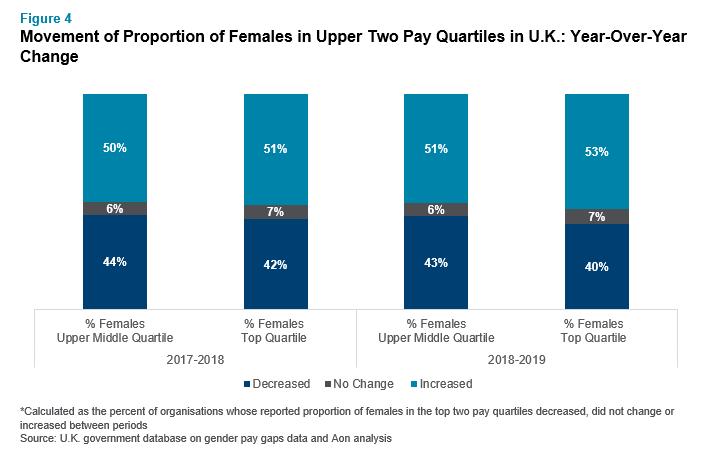
On a positive note, we discovered that more companies reported increases rather than decreases in the percentage of females in their upper quartiles. Furthermore, the proportion of organisations that reported increases grew during over the time period we studied. We also found that 21% of companies reported an increase in the percentage of females in their upper middle quartile and 24% reported an increase in the percentage of females in the upper quartile during both time periods.
These data points support the notion that female leadership initiatives are slowly stimulating change. However, there is still much work to be done in closing gender pay gaps. Below we have outlined key considerations for addressing your gender pay gap.
How to Identify Skews to Gender Pay Data
Analysis is crucial to understanding gender pay disparity across the U.K. However, gender pay submissions often seem to generate more questions than answers. This is largely due to the various factors that can affect data points, which then lead to a skew in data and ultimately cloud the bigger picture.
Some critical areas to consider when conducting your gender pay gap analysis include:
- Workforce composition: Take note of your male to female ratio. If the workforce is primarily male or primarily female, this can affect the mean/median data point significantly.
- Outsourcing: Outsourcing low wage labour can massively impact the overall outcome of your data.
- Smaller business entities: In the U.K., companies with less than 250 employees are not required to report gender pay gaps. This has raised concerns that the existence or creation of smaller entities may be a way of avoiding gender pay scrutiny in its entirety, thus removing critical insight.
- Accuracy and ambiguity: Company interpretation of the regulations and related gender pay guidance can vary across the market. Observers, including Aon, have highlighted some organisations’ figures as statistically unlikely, calling into question the overall data integrity.
- Positive bias: Gender pay reporting was made non-compulsory this cycle due to COVID-19. If the organisations that chose not to submit have more significant gaps, this might imply a false outcome for this year’s data.
Next Steps: Reset and Refocus
One of the most common questions we receive related to gender pay is, How can we do better? Our recommendation is to take a step back, reset and refocus your attention on these three core areas:
- Analyse your data: Submitting the required data in isolation without further reporting can lead to a misinterpretation of your pay gap. Including a thorough supplementary analysis when publishing your results can help to explain and expand on the nitty gritty aspects of your business and the reasons behind certain numbers, which may remain hidden if only the required data is analysed.
- Ensure compliance: It’s easy for errors to creep into reporting if you’re not 100% confident with the data requirements and nuances of the calculations. If you are unsure, reach out to a consultant and ask for further guidance.
- Prepare your firm to go beyond gender pay gaps and look at other unexplained pay gaps by race and ethnicity: This has never been more relevant. As efforts to foster more diverse and inclusive workforces continue to grow, companies should look at pay inequities more broadly.
Pay equity is an all-encompassing initiative that should be addressed holistically and on an ongoing basis. The firms that do will find themselves in a much stronger position with respect to their employer brand, employee experience proposition, pay transparency and overall fairness.
To learn more about gender pay gaps and how to address pay equity at your firm, please visit our website here. You can also reach out to a member of our rewards consulting group at rewards-solutions@aon.com.
Related Articles