At technology companies, the distribution of employees by job function varies significantly from country to country, which has big implications for any firm looking to hire staff in new markets.

Leveraging Radford’s growing Workforce Analytics platform, we now have access to critical insights on the makeup of technology sector labor pools across countries. As one might expect, there are important differences in the distribution of employees from job function to job function as you move from market to market. However, in many cases, these differences are far more dramatic than one might initially assume.
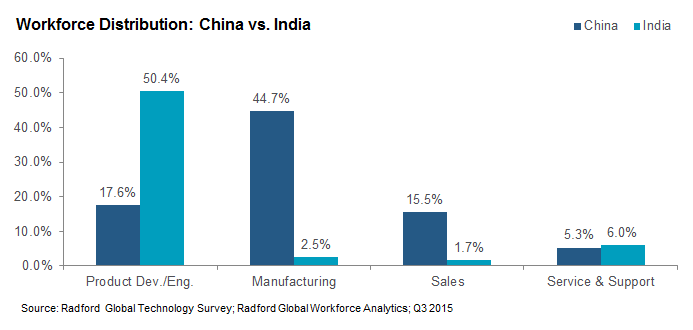
For example, while the Chinese and Indian labor markets share many macro-level characteristics— they are both powerhouse economies in Asia with growing domestic technology sectors spanning multiple talent hubs— the distribution of employees by job function in each country indicates significant differences in the composition of their respective technology talent pools. Ultimately, this means potential employers in each market should have vastly different expectations about the types of people and skills they can recruit in each country.
As the chart below illustrates, India has a far greater proportion of its technology sector employees serving in product development and engineering roles relative to China— 50.4% of the India population in our analytics dataset vs. 17.6% of the China population. Meanwhile, China has a much larger percentage of its workforce serving in operations and manufacturing roles relative to India— a startling 44.7% vs. 2.5%. There is also a wide disparity in sales roles— 15.5% of the population in our China dataset is in the sales function, compared to only 1.7% of the population in India. In only one functional area, customer service and support, we observe similar levels of workforce distribution in both nations, which is tied to the way these countries have historically developed and grown their technology industry.
Of note, while the values cited above and in the chart below do not reflect the absolute number of available workers in each job function (that data is available separately), they highlight how varied talent pools can be from one location to another. There are also other important implications. For example, nations with higher concentrations of workers in any given function will also be more likely to have people working at every level within those functions. That means greater access to senior individual contributors, managers and executives. This makes for both a larger and richer hiring environment.
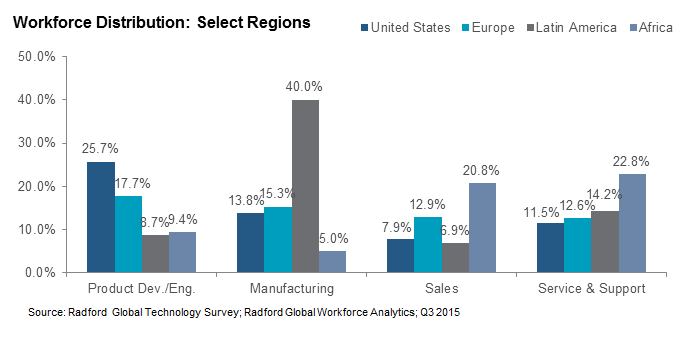
Looking beyond China and India, technology sector workforce distributions continue to differ significantly across many other global regions. For example, the percentage of employees in product development and engineering roles among the four regions displayed in the chart below varies from 25.7% of the population in the US to only 8.7% of the population in Latin America and 9.4% in Africa. In terms of manufacturing roles, Latin America stands in sharp contrast to other regions— a full 40% of its workforce is in operations or manufacturing jobs. These distributions indicate clear preferences among companies for how they allocate talent in each region. The US and Europe lead in product development, while Latin America and Africa have a bigger distribution of employees in customer service and support.
Next Steps
When multinational or emerging technology companies analyze their international growth plans, determining the composition of local workforces in target markets is critical. Companies that take time to analyze existing labor pools will gain important advantages by understanding which job functions have the highest prevalence of available employees and gaining insight into how they can efficiently model their operations from country to country.
As companies expand their workforce globally, they can avoid costly mistakes by staying attuned to the talent infrastructure in each local market. For example, using Radford’s Workforce Analytics platform, we can see that nearly half of China’s technology employees are working in operational and manufacturing roles, while only 2.5% of the technology workers in India are employed in that function. This significant gap can help provide the additional insight needed in the decision-making process for any company considering further expansion or the deployment of operational and manufacturing roles in either country.
Of course, data of this nature is only a starting point. Companies can and should drill down further, looking at workforce distributions in key regions or cities, and then layering on data like turnover rates, hiring rates and the rate of annual salary increases to fully assess the pros and cons of entering a market. Other key questions to ask include: What is the supply and demand for qualified employees who can perform the specific tasks we need for our business? What are the high, low and median levels of total direct compensation in the job functions in countries where these roles are hard to fill? What kinds of benefits are local companies offering these types of individuals?
To learn more about participating in the Radford Workforce Analytics platform, please contact our team. To speak with a member of our compensation consulting group, please write to consulting@radford.com.
Related Articles