Aon’s new Organizational Risk Scorecard provides key benchmarking data for technology and life sciences companies on employee mobility, composition and management.

Failure to attract or retain talent was listed as a top risk in Aon’s 2019 Global Risk Management Survey. Aon’s new Organizational Risk Scorecard helps leaders mitigate this concern by providing detailed workforce-related benchmarks that can help identify potential risks or gaps to be addressed that may otherwise go unnoticed. Built with data from two million employees at nearly 600 global companies, all the information is carefully mapped to the Radford job structure, making benchmark definitions comparable and meaningful.
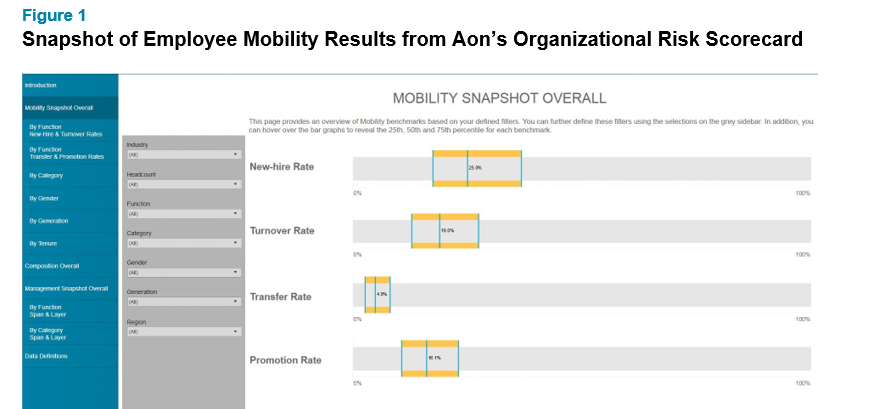
Imagine you’re in human resources at a software company in the Bay Area and losing 25% of your workforce annually. While that might seem like an unsustainable rate of loss, is it really that high given this hot talent market for technology skills? The Organizational Risk Scorecard will give you the answer by providing benchmarking data on turnover, promotion rates, gender and generation breakdowns in the workforce, spans, layers, and more. Benchmarks are provided for the 25th, 50th and 75th percentile. A snapshot of the online tool is shown in Figure 1.
To illustrate how the tool can be used, we conducted an analysis of U.S.-based employees at 373 technology companies and calculated employee mobility, composition and management benchmarks. The filter function allows users to customize their search by industry, headcount, function, category, gender, generation and region.
From our analysis, we found the median new-hire rate at these companies is 22.6% with a turnover rate of 18.2%. and a transfer rate of 5.0%. This data shows technology companies are hiring at a slightly higher pace than they are losing talent. Finding out how your company compares to these mobility benchmarks can help you identify potential areas of risk in your organization. For example, if your transfer rate is lower than the benchmark, you may not be providing your employees with enough internal opportunities.
Diving deeper into the turnover rate, we found the highest median rates occurred in the sales function (20.9%) followed closely by the marketing and business development function (20.5%). Based on job category, the highest turnover occurred in the executive (19.2%) and support (18.9%) groups. If you have certain job functions or groups experiencing turnover much higher than the benchmarks, then it might be time to look into your total rewards programs.
As we continued our analysis, we found that the overwhelming majority of employees were males at 72.0%. In addition, Generation X (birth years 1965 - 1980) comprised the largest group of employees at 44.7% followed by Millennials (birth years 1981 - 1996) at 34.9%. The tool allows users to review both gender and generational differences across all of the employee mobility metrics (i.e., new-hire rate, turnover rate, transfer rate and promotion rate). This data can answer questions like: “Are Millennials at my company leaving at a higher rate compared to other generations relative to the benchmark?” and “Are females in my organization promoted at the same rate as the benchmark?”
Our analysis also found the median span (i.e., the number of direct reports per supervisor) in the U.S. technology sector was 4.0 but with a wide range from 3.0 to 8.0 across functions. The ability to access benchmark data by job function is valuable as certain job functions may operate well with higher spans while other functions may operate better with smaller spans.
Finally, we examined layers, which is the number of reporting levels from the bottom of the organization all the way up to the CEO. The technology companies in our analysis had a median of 4.0 layers, however, that number varies widely by company headcount. Looking at the benchmark number of layers is helpful in determining whether you need to dig deeper to see if potential problems in your workforce could be caused by too many or too few layers. For example, having more layers than the benchmark can prompt business leaders to examine manager headcount and assess total salary expenses.
Next Steps
The Organizational Risk Scorecard’s ability to drill deep into each of the benchmarks under the three main categories — composition, mobility and management benchmarks — is powerful. It allows organizational leaders to answer their top risk questions, such as:
- Are we losing more employees than our competitors in the regional labor market?
- Are we employing fewer women in top job functions than others? Is this because we are promoting our women less than our men?
- Are we becoming too hierarchical with too many layers and managers with only one or two direct reports?
With our new Organizational Risk Scorecard and research capabilities, our People Analytics team can enable organizational leaders to manage risk in ways not possible before. As a separate service, we also offer the ability to select a specific organizational peer group for benchmark comparisons and can partner with organizations to design solutions to address risks related to turnover, composition, an aging workforce, among others.
To learn more about the Organizational Risk Scorecard and receive a demo of the tool, please contact one of the authors or write to rewards-solutions@aon.com.