The topic of CEO compensation can evoke provocative headlines to stir controversy, but the data can be misleading and especially problematic for companies that use this data for benchmarking pay against peers.
 The topic of chief executive officer compensation can often evoke provocative headlines in various media outlets. The problem is that these headlines, designed to capture the public’s attention and stir controversy, are often based on backward-looking data. Media reports use proxy filings, which reflect the previous year’s compensation decisions rather than what is current at the time of publication. While this can be misleading for companies that are targets of this reporting, it can also be problematic for companies that use this data for purposes of benchmarking pay against their peers.
To ensure pay trends are timely and accurate, Aon’s annual Total Compensation Measurement (TCM) survey of executive compensation, which will be released on July 31st, captures current CEO pay — that is, 2019 salaries, target bonus opportunities and long-term incentive awards.
In this analysis, we focus on changes in pay for 182 companies that had the same CEO in place for 2018 and 2019. The four areas of CEO pay we’ll cover include:
- Base salary
- Target bonus
- Long term incentives
- Target total compensation (base salary plus target variable pay)
Our findings from this year’s analysis shows continued single digit increases in CEO total compensation, as has been the case for the past several years. Median target total compensation across our constant sample of companies increased 9%, with the bulk of the gain coming from increases in annual and long-term incentive opportunities. Base salaries, on the other hand, increased at modest levels consistent with the broader employee population.
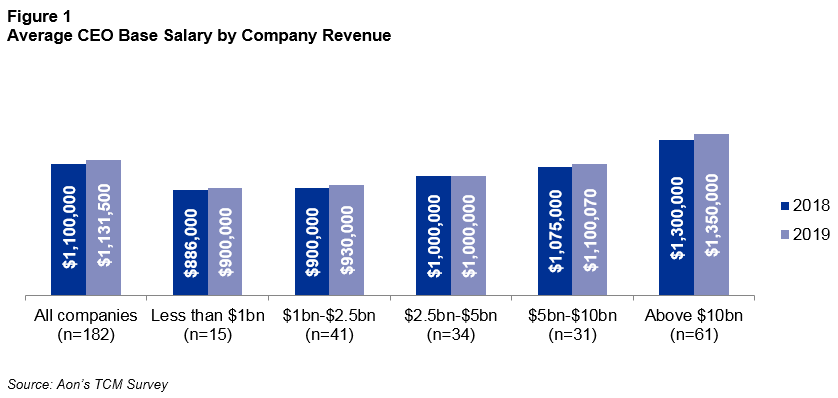
Base Salary
Base salary levels for CEOs show a minimal change in 2019 of 3%, roughly the same as the median merit increase for the broader employee population. The largest salary increases — about 4% — were seen among companies with revenue above $10 billion.
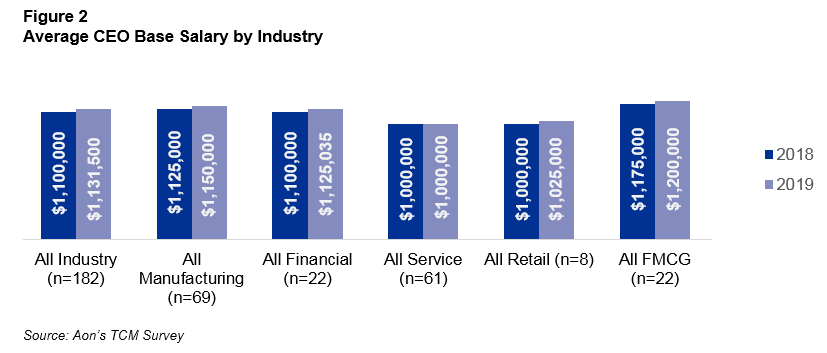
Breaking down the results by industry, median base salary rose roughly the same across each industry.
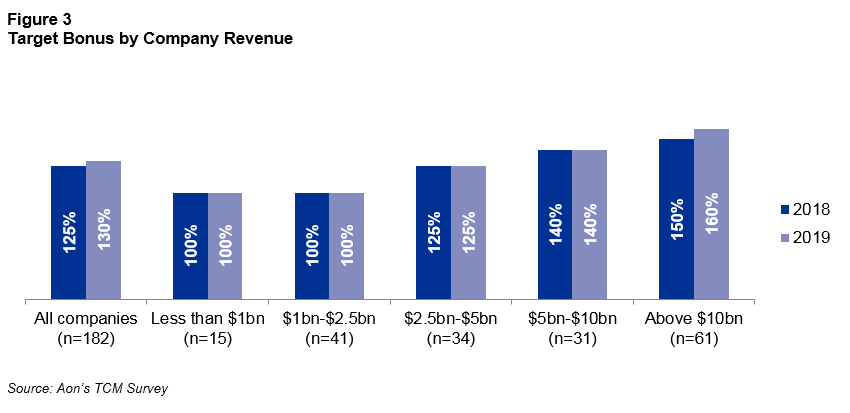
Short-Term Incentives
Target bonus opportunity rose five percentage points since 2018. However, apart from the largest companies which rose 10 percentage points, median target bonus opportunities were unchanged.
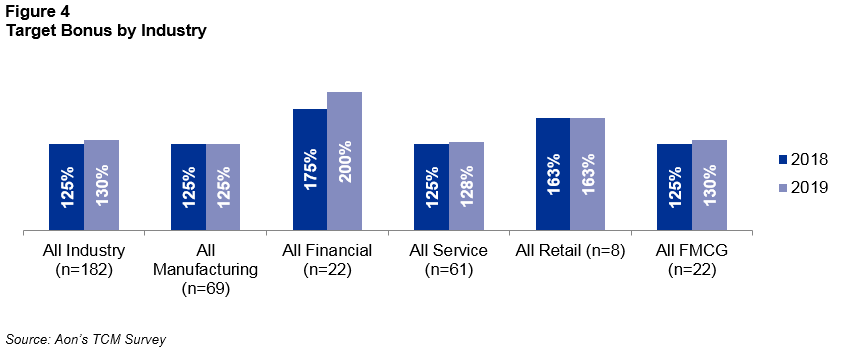
If we look at the target bonus opportunity by industry, the increase in opportunity is limited to financial services, which rose an impressive 25 percentage points, and fast-moving consumer goods (FMCG) at five percentage points.
 Long-Term Incentives
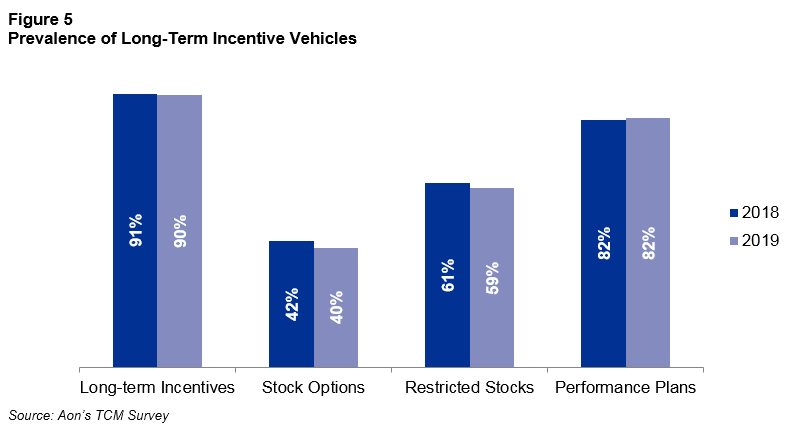
Among the 182 participating companies, 90% grant long-term incentive awards to the CEO. The prevalence of LTI vehicles is generally unchanged year-over-year with a slight decline in stock options and restricted stock, and no change in performance plans.
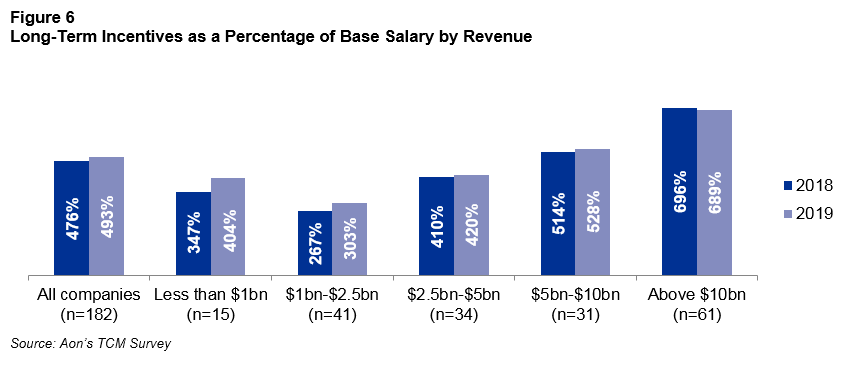
The overall value of LTI awards as a percent of base salary has increased 17 percentage points (or 4%) compared to 2018, which is slightly more than base salary increases. However, this increase is mostly driven by smaller organizations.
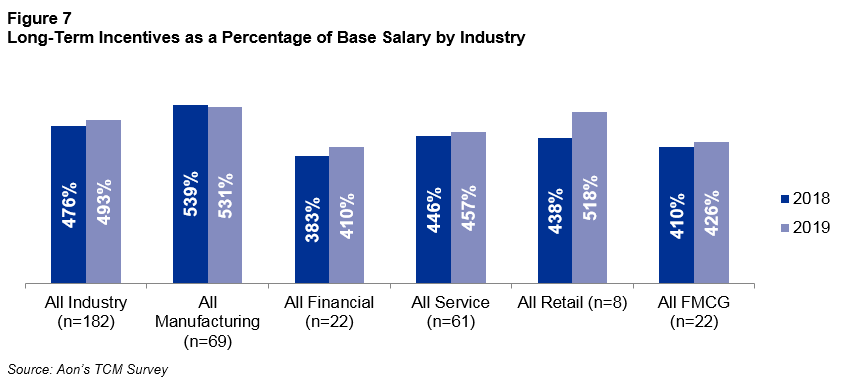
Among industries, financial services and retail had the largest increases in LTI value.
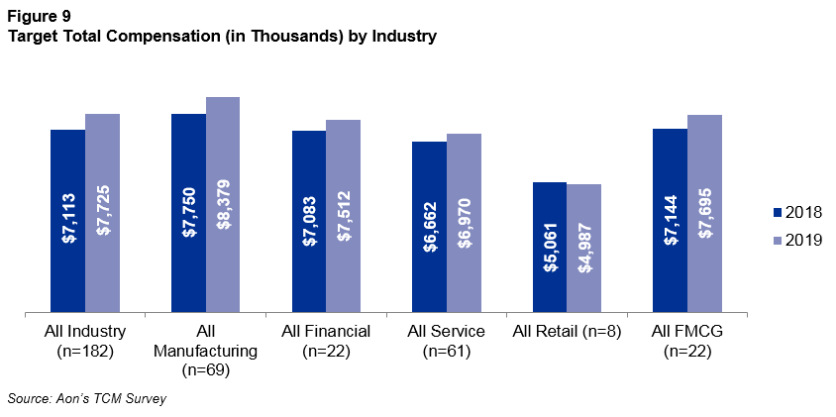
Target Total Compensation
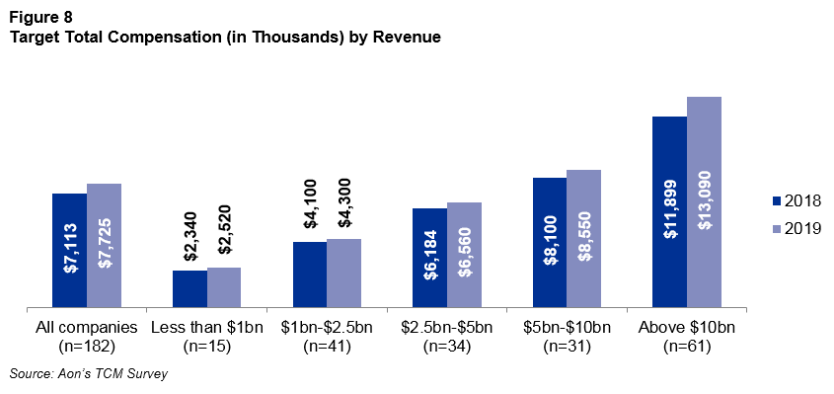
The median target total compensation for these CEOs increased 9% from $7.11 million in 2018 to $7.72 million in 2019.
- Base salary: 3%
- Target bonus: 4%
- Long-term incentives: 5%
Companies with revenue above $10 billion have the biggest increase in target total compensation of 10% while smaller companies report an 8% increase. By industry, major increases are seen in manufacturing, FMCG followed by all financial industries. The retail industry reports a slight decrease of 1% in target total compensation.
Next Steps
Participating in Aon’s Total Compensation Measurement (TCM) Survey gets you access to key pay trends, including movements in total CEO pay year-over-year. The survey covers senior management and executive roles, management and individual contributor roles, and non-exempt roles. TCM participants can get access to the 2019 data starting July 31, but will need to submit data in order to get access.
To learn more about year-over-year pay trends and how to participate in the TCM Survey, please contact us now.
Related Articles