India Highlights
- India continues to maintain its labor cost advantage relative to the US, with fixed compensation levels for entry-level and mid-career professionals ranging between 15% and 25% of US base salaries
- However, the pay gap between India and the US is narrowing for higher-level management and executive talent, where fixed compensation levels are approaching 70% of US base salaries
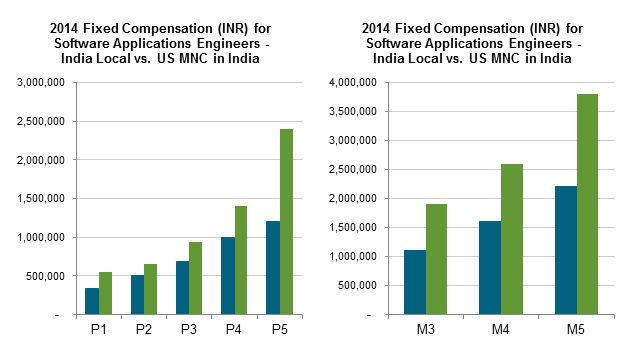
- Highly-targeted benchmarking within India remains a must to address variations across cities and company types; for example, US-headquartered multi-nationals in India provide a 50% to 70% premium in pay over local companies headquartered in India
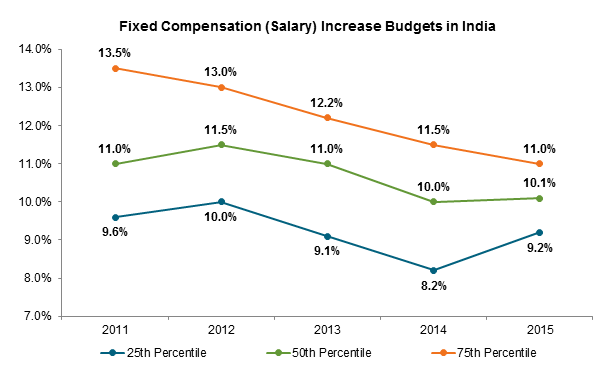
- Demand for talent in the Indian technology sector remains high, meaning compensation budgets should continue to grow by double digits; the forecast for 2015 is 10%
India Maintains its Labor Cost Advantage
Over the last three decades, multinational companies (MNCs) have realized significant labor cost advantages by placing staff in India, and they continue to do so today. These cost savings led to the offshoring of back office operations to India in the 1980's, followed by the outsourcing of “Y2K” troubleshooting at the end of the last century. Today, MNCs increasingly look to India as a potential hub for large-scale research and development operations, moving India up the value chain, along with pushing pay and the competition for technology sector talent to new levels.
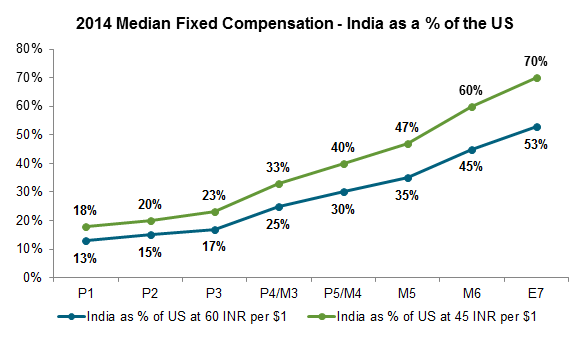
Yet, while employees in India's technology sector enjoy improved opportunities and have witnessed average annual base pay increases ranging from 10% to 14% over the past several years, fixed compensation levels (i.e., base salary) remain at a sizable discount relative to the US. The disparity between India and the US is further exaggerated by the recent devaluation of the Rupee (INR) from 45 INR per $1 in 2010 to today's exchange rate of roughly 60 INR per $1.
Digging deeper, when it comes to the India vs. US wage gap, there are significant differences in potential labor cost advantages by employee level. For example, Indian employees in Radford survey level P1 (entry-level professionals) currently earn 13% of their US counterparts, whereas Indian executives in Radford survey level E7 (typically vice presidents) currently earn 53% of their US counterparts. As the chart below illustrates, assessing labor cost advantages in India requires a detailed view across job levels, with currency fluctuations serving to exaggerate or condense differences by level over time.
India is Diverse, So Too Are Its Compensation Practices
Just as India is a highly diverse nation – made up of multiple languages, religions, ethnic groups and customs spread across a tremendous geographic range – so too are its compensation practices. India is not a single talent or compensation market.
In India, as in the US, there are important variations in pay patterns among technology sector sub-industries (e.g., software vs. semiconductors) and regions (e.g., tier 1 vs. tier 2 cities). However, assessing pay in India require one to understand additional layers of complexity typically not found in the US. One of the most important factors is the disparity in pay between US-headquartered multi-nationals operating in India and local companies headquartered in India. Today, pay premiums for the same job level at a US MNC vs. a locally headquartered company can range from 50% to 70%.
Failure to take variations of this nature into account can mean the differences between entering the race for talent as a competitive force or as a firm woefully short of market realities. At Radford, we offer standard reporting options for key Tier 1 and Tier 2 cities to address these issues, and increasingly counsel companies to consider multiple custom peer groups (depending on your deployment of talent in India) to address factors including:
- Industry (e.g., software vs. semiconductors vs. professional services);
- Tier 1 vs. Tier 2 cities; and
- Location of global headquarters (e.g., local companies vs. foreign multi-nationals).
Reasons for the differences in pay levels and practices between local Indian companies and US MNCs operating in India vary. One possible explanation is a lack of workforce readiness among new college graduates in India. At first glance, this may sound counterintuitive, as a big part of India's attractiveness to foreign employers is that it produces a large and steadily increasing number of college graduates— over 5 million per year compared to less than 2 million per year in the US. Plus, institutions like the Indian Institutes of Technology (IIT), located in major cities throughout India, are known for the high caliber of their engineering and management programs. Yet, several studies indicate that the actual percentage of India's new college graduates that are well-prepared for the workforce is low, especially MNC workforces. Readiness also varies considerably based on the university.
This means a significant investment in training and development is often required to turn “fresh” college graduates into fully productive employees capable of meeting best practice standards. Smaller units of MNCs may be less willing to make these investments, instead opting to use slightly more experienced workers at higher rates of pay. Meanwhile, locally headquartered companies are more interested in developing new local talent, offering reduced fixed compensation in exchange for a richer overall employment proposition filled with career development opportunities.
Along these lines, the “barriers to entry” at US MNCs are typically higher. US MNCs require strong English language skills and experience with western business practices, and will likely opt to recruit talent from other US MNCs in India. This creates a narrower talent pool where pay ratchets up more quickly. Of course, overtime, these hurdles will come down as more Indian companies grow to become global firms themselves.
Overall, the disparity in pay between US MNCs operating in India and local companies headquartered in India highlights the importance of understanding a company's talent requirements in India, and all of the nuances that might be associated with fine-tuning recruitment and compensation strategies for your specific talent profile.
Double Digit Fixed Compensation Increases Continue
As overall economic growth moderates in India, fixed compensation (i.e., salary) increase budgets are slowing down as well. However, we still expect budgets to remain in the double digits for 2015 as technology sector hiring remains robust.
With budgets trending downward, more attention is now being paid to the allocation of budgets in India, with considerable performance-based differentiation reported in the past few years. Top performers may receive increases of 1.5x to 2.0x the average employee, further complicating views of the market. Increasingly, compensation professionals will need to reconcile between specific cases where practices might differ widely from macro trends. For example, offering 25% annual increases to a group of key employees in India, while others in the same location receive 5% to 10% increases. With this in mind, although overall salary budgets are in the double digits for India, actual job values might increase at a much lower rate depending on job level and demand. Comparing market data in India from 2006 to today, we observe that professional and management job values have increased at an average rate of less than 4% per year. For some of the most commonly staffed positions in India, such as Software Development Engineers and Programmer/Analysts roles, job values have increased by about 5% on average over the last eight years. Job specific trends should be taken into account when considering whether to age or project survey data.
Using Radford Data Effectively
As of April 2014, Radford's Global Technology Survey database in India included information for nearly 1 million incumbents in 1,189 jobs working at 387 different organizations. Of this dataset, 60% of the incumbents work for companies locally headquartered in India. Most of the remaining 40% comes from US MNCs operating in India.
Beyond overall compensation totals for India, Radford provides 17 specific data breakouts for India, covering multiple technology sub-industries or key Tier 1 and Tier 2 cities. As we alluded to earlier, appropriately targeting your benchmarking sources is critical to getting relevant compensation information in India. And again, to make the most effective use of Radford's robust survey database, companies are encouraged to take advantage of the ability to order custom peer group reports by choosing the specific companies that most closely match their specific talent needs. This enables clients to conduct focused benchmarking exercises with greatest likelihood of success and local market acceptance.
To learn more about participating in a Radford survey, please contact our team. To speak with a member of our compensation consulting group, please write to consulting@radford.com.
Related Articles